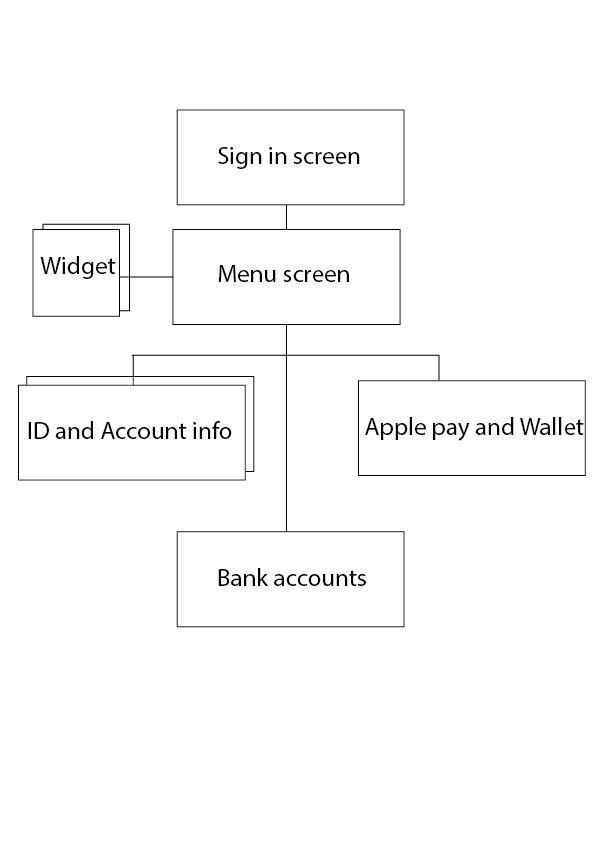
Wireframing
This wireframe shows the first sign in page, the menu page, and the ID page for the user.
The remaining wireframes show the wallet page, a calendar widget page and the different banking account page.
Week 6
For our weekly workshop we were looking at organising our pre production, production and post production time into a Gannt chart in Microsoft Excel 2016. As I had not looked at excel personally before, this deemed a challenge. We were shown a helpful YouTube video to allow us to complete this objective and we could either use an easier google version or the more precise and more aesthetically professional way of completing this in Microsoft excel. 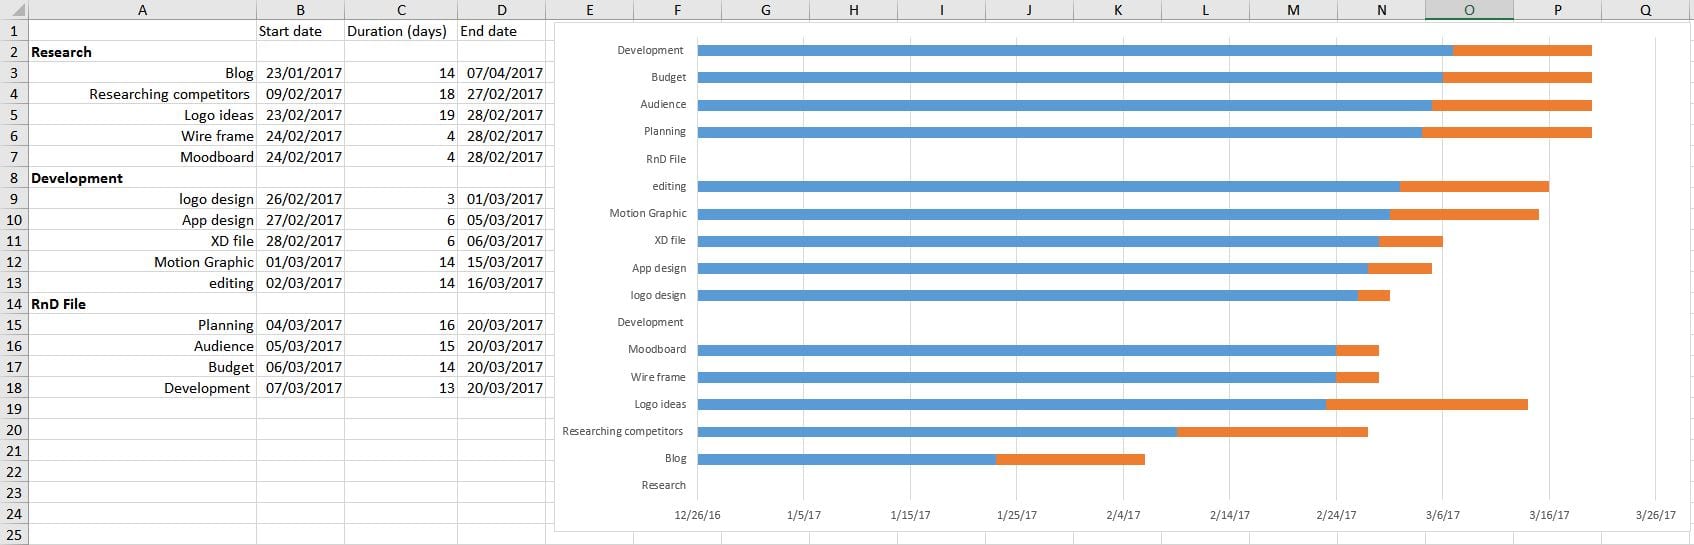
This Chart will help me to stick to a schedule and will allow me to alter the dates if certain tasks do not get completed within the time scale. Even though I had not used Excel before, this became simpler as the time throughout the workshop went on and I was even able to help out a peer who was having trouble with their Gannt chart.
Week 5
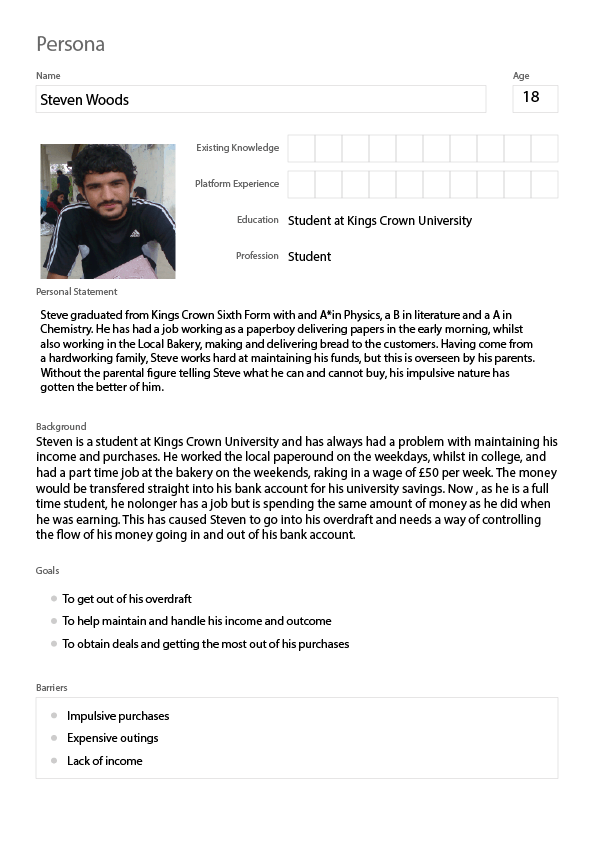
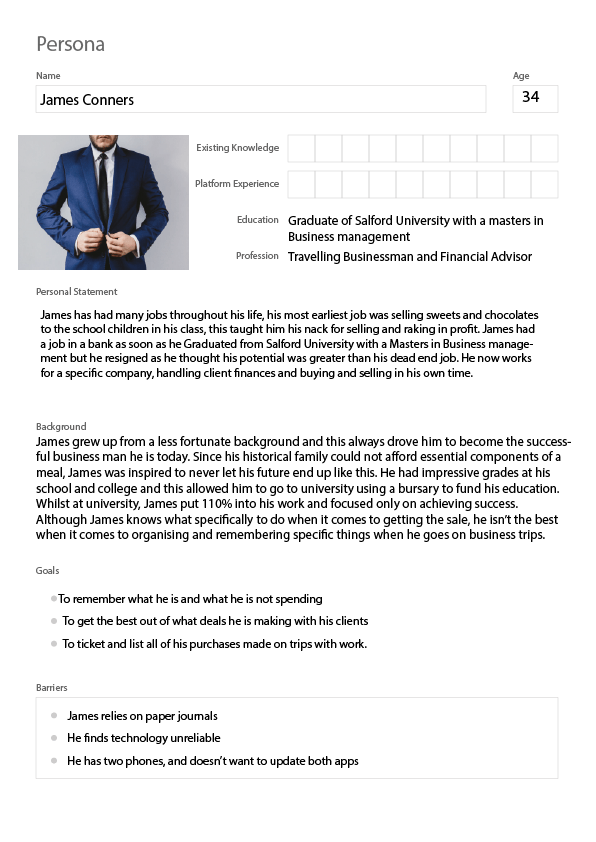
For this weekly workshop we looked at personas and how they represent to two opposite spectrums of our target audience. For example if the target audience was 16-30, there would be a persona and how it would relate to the person who is 16 years old using the application and then there would be another one for the 34 year old. There is not always two, sometimes there are a lot more, depending on how wide the target audience is. As these audience members are different ages, they also would use the app for two completely different reasons. One would use it to help his career and the other would use it to maintain his income and outcome as financial aid.
Scope pages
Here is my initial design for my scope pages with annotations. I scanned them using Scannable which allowed me to save them to Evernote and send them to myself via email. I would have preferred a proper scanner as the quality of the scans are not brilliant.